PowerPoint 2016’s changes include new transitions and charts, and some powerful new research tools. Other features may follow the Office 2016 trend of being individually subtle, but taken as a whole they add up to some worthy reasons to upgrade.
Let’s start with the larger toolbar up top, the Quick Access Toolbar, and the reorganized Ribbon menu. The Ribbon menu spreads out more, resulting in fewer icons and more drop-down menus—slowly working its way back to the original menus (from the beginning through 2003).
Each of the following graphics were captured at 100%, normal size. Notice the difference between the 2013 and 2016 Ribbon and Tab menus.
Here are the menus from PowerPoint 2013:
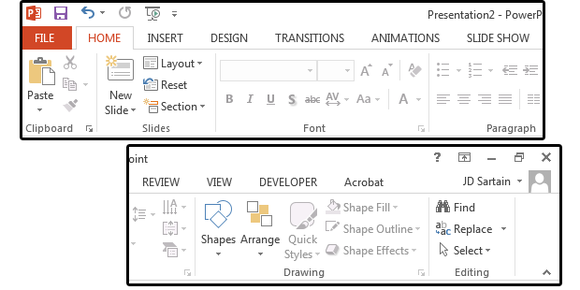
And here are the same menus in PowerPoint 2016:

Notice the two new faces on the Ribbon: the Tell Me What You Want to Do option at the end of the main Tabs menu (preceded by a light bulb), and the Share tab, which provides options for collaborating via the cloud.
Tell Me What You Want to Do
This new feature is a quick and easy way toget help on any feature or process. Just place your cursor beside the light bulb or click Tell Me What You Want to Do and type out your question. For example, type add animation or and several related options appear in a drop-down list. Select an option and a submenu appears with features, additional options, instructions, or another submenu.
In this case, the Animation submenu appears, displaying a variety of effects. Scroll through the list, or choose one of the More Effects submenus to see additional options.

Real time co-authoring
Now you can share and co-author projects thru the cloud. Click Share on the Ribbon menu to save your presentation on SharePoint, OneDrive, or OneDrive for Business. Next, the Share panel prompts you to invite people to share your projects. To access your Outlook address book, click the small book icon on the right side of the Invite People field. Once selected, click the permissions field below Invite People field to give your collaborators different levels of access to the document, and enter a message if desired. Finally, click Share.
PowerPoint then sends an email to your colleagues, inviting them to view or edit the presentation. You can also attach a copy or a PDF of the presentation to the email.
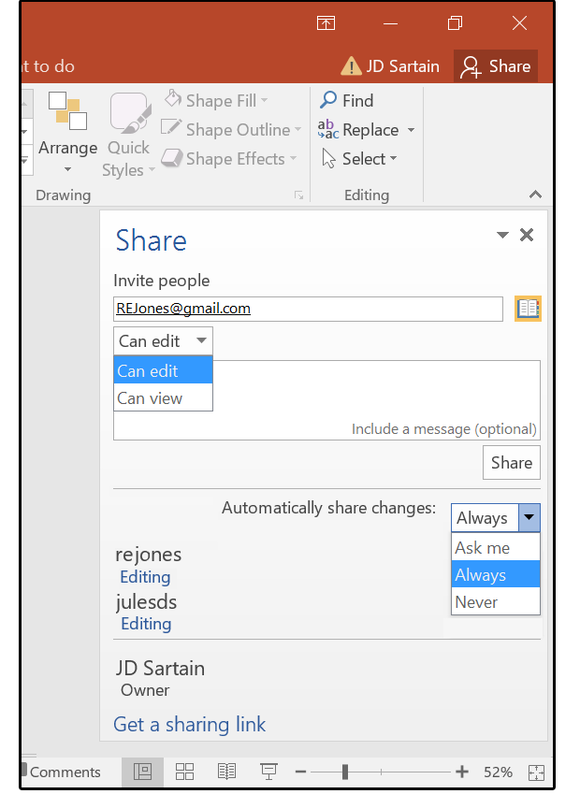
Note: Choose File > History to view a list of all changes and/or to view or access earlier versions. Also notice that when you export your presentation to video, you can choose the file resolution based on the output screen.
Smart Lookup aka Bing Insights
This feature is an upgraded improvement of the previous Smart Lookup function in 2013, with a new name: Bing Insights. In a nutshell, it’s a quick click to the Internet driven by several sources such as Bing Snapshot, Wikipedia, the Oxford dictionary, and Bing’s image search, and it functions inside PowerPoint.
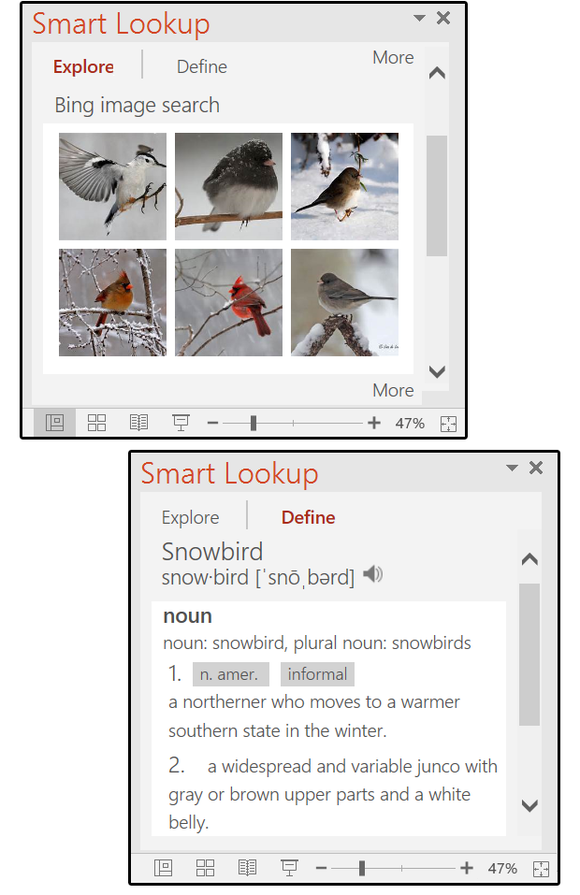
Select a word or phrase from one of the slides, right-click it, then choose Smart Lookup from the drop-down menu. The Smart Lookup panel appears on the right and displays several results of your search word (with images if available). Scroll down to view all results.
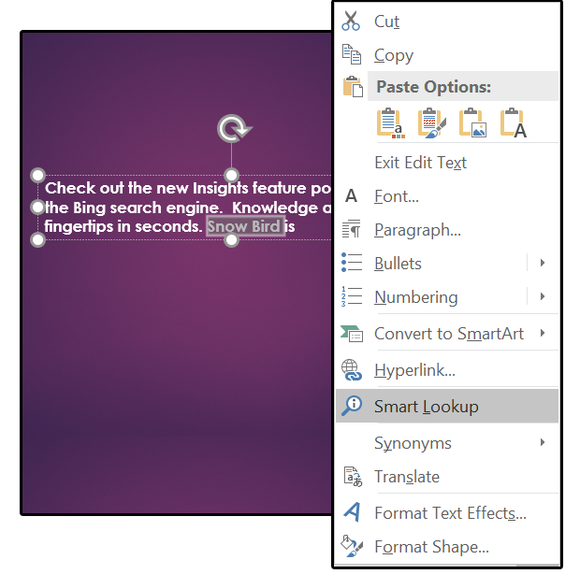
The Smart Lookup panel provides two search criteria options: Explore for information and images or Define for definitions, synonyms, grammar options, and word origin.
Ink Equations
This feature also shows up in Word and Excel 2016. Select Insert > Equation and choose one from the Library (list) or select Insert > Equation > Ink Equation, and manually write one (with a stylus, mouse, or your fingers) on the popup drawing board, which Office then converts to text. Options on the drawing board include Write, Erase, Select & Correct, and Clear. Not a feature for everyone, but the Math geeks will like it.

Graphics
There are a few new graphic features: a new transition called Morph; an assistant feature called Design Ideas; some new, quick formats for shapes; and five new chart types.
Morph transition
The nuances of transitioning between slides can mean the difference between a lively, interesting presentation and a snoring audience. The new Morph transition makes the objects appear animated as they fade in and out of the frame. The slides must have one or more objects in common for it to work.
The easiest way to set up a Morph transition is to create all the objects on the first slide, then duplicate that slide as many times as needed. Then move the objects around, delete some of them, or rearrange the order so the objects appear to dance around the screen from one slide to the next.

Quick Shape Formats
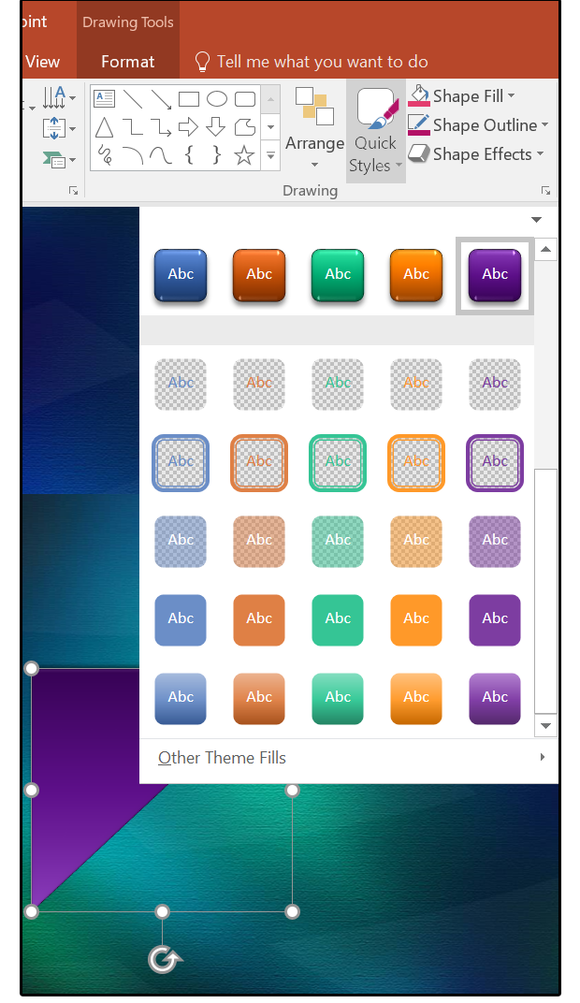
This feature is another way to help designers quickly create a slide presentation. Instead of always creating new styles for the shapes designers use in presentations (which takes time), PowerPoint has provided a number of “preset” styles that you can place with a single click. If more custom work is required, it takes far less effort to click through a color palette than it does to wade through all the effects.
Draw a shape. While it’s still selected, click Quick Styles, then choose a preset from the menu. Whenever a shape is selected, the Format/Drawing Tools menus automatically display with the Drawing group open.
Design Ideas
This new feature provides several “Design Ideas” for the layout of each slide in your presentation that contains graphic elements. Think of it as a your personal advisor who looks over your shoulder and provides ideas for better presentations. It’s automatic, too: As soon as you Insert an image, the Design Ideas panel opens on the right, offering several layout options for the design of the current slide.
Select a layout, then continue adding more content to your slide. If none of the Design Ideas appeal to you, then close the panel and create your own layouts.
Design Ideas for presentation layouts

New charts
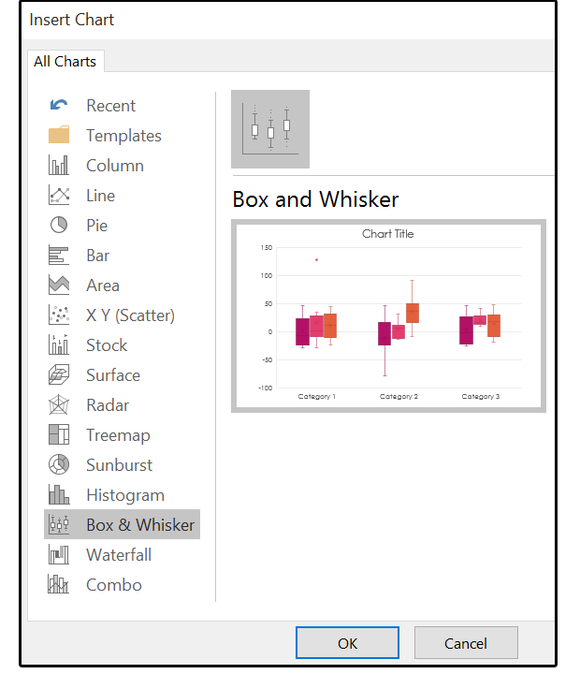
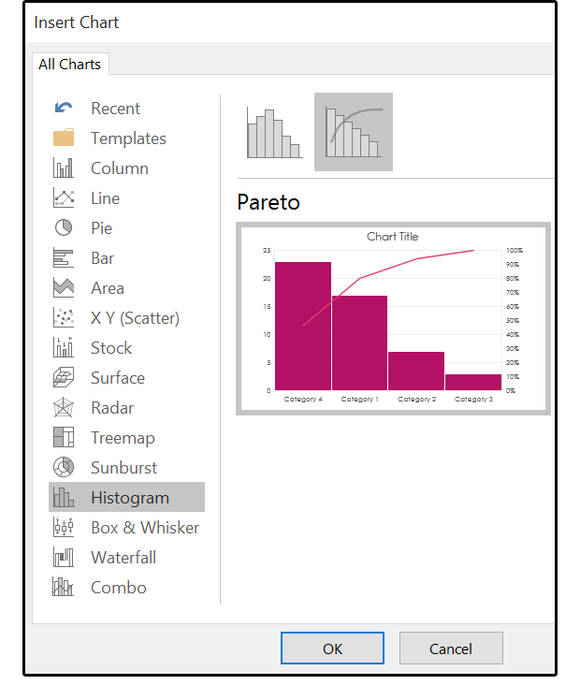
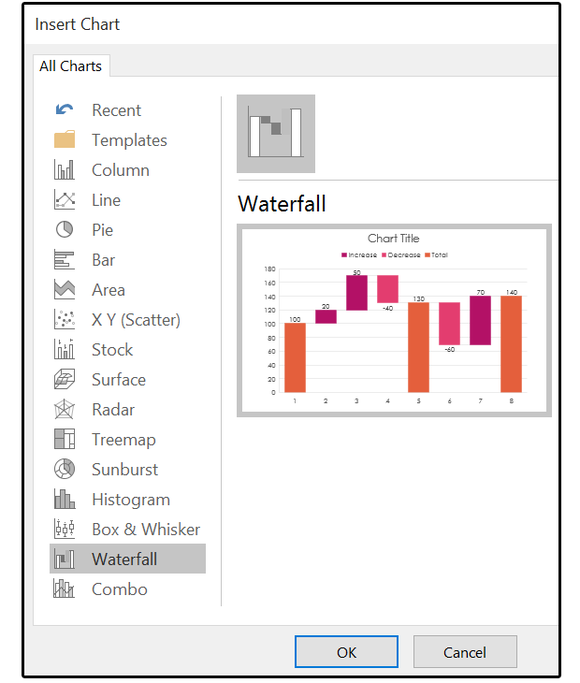
PowerPoint has five new charts to show off your numbers: Treemap, Box and Whisker, Sunburst, Pareto, and Waterfall. Just click Insert > Chart, then select one from the list. When the spreadsheet or table pops up, enter the chart data and watch the image change right before your eyes.
Click the + sign to modify the chart elements such as Title, Data Labels, and Legend. Click the paintbrush to modify the style and color.

Treemap
Box and Whisker

Sunburst
Pareto


ثبت نظر